Although the Dispatcher Pattern, which we covered in Part 1, helped Larry solve his challenge of deploying more than 10 client scripts to a single record type, he has not been able to silence these questions ringing in his head: Why 10? Is there a guaranteed, significant performance degradation after this magic number? Why is there a hard limit for client scripts but not for user event scripts?
In this article, I offer a method to assess NetSuite performance using the dispatcher pattern as a reference while attempting to help Larry quiet the questions in his head. The technique outlined in this article can be useful for assessing NetSuite performance in other contexts.
Table of Contents
Context
Recap of the Dispatcher Pattern

The above diagram summarizes the dispatcher pattern which we covered in detail in Part 1. The concept is simple: Instead of deploying multiple scripts to a record, we replace them with a single “dispatcher” script. We learned that the pattern is very easy to implement with minimal refactoring required. Thus, it allows us to meet NetSuite’s hard constraint of at most 10-client script deployments per record type and buys us time for the real work of optimizing our scripts/deployments.

However, the warning message in NetSuite cites “performance reasons” as the basis for this 10 client script limitation. Thus, our goal is to try to understand what that really means. More concretely: Is there a noticeable performance impact (positive or negative) of indirectly running more than 10 client scripts using the dispatcher pattern?
We performed some testing that we believe allows us to make grounded assessments. Before describing the tests and presenting the results, it is meaningful to provide a quick overview of NetSuite’s native options for performance assessment.
NetSuite Performance Measurement Tools
NetSuite offers some inbuilt tools to help with performance studies.
1. Application Performance Management (APM) SuiteApp

APM is a free tool offered by NetSuite via the SuiteApp Marketplace. Customers can install APM in their NetSuite account and use it to monitor various performance metrics. APM can help identify performance bottlenecks in scripts (real-time or background), searches, workflows, etc. You can learn more about APM by reading the official documentation.
I have found APM useful for performance assessments. It can help one quickly identify system performance bottlenecks and provide statistics averaged over up to 30 days. However, for the question at hand, we are trying to investigate the effect of a single variable on performance. APM does not offer that granularity. To use APM successfully, we would need a way to effectively exclude all other variables that may affect performance. It may be possible but I opted for an easier and quicker way using the page performance details tool described next.
2. NetSuite Page Performance Details Tool

Double-clicking the NetSuite logo on any page will expose the page performance details as illustrated above. This gives us instant performance data and allows us to target specific records where we can quite easily strip out undesired performance variables. Thus, I opted to use this tool.
The following is intended to outline a general pattern for assessing performance and provides results from a limited test conducted in a single NetSuite account. It is not to be misconstrued as a benchmark of NetSuite’s general performance and cannot serve as the basis for any decisions concerning NetSuite’s performance. Anyone seeking to understand NetSuite performance must make their own assessments to the extent permitted by the Oracle NetSuite terms of service.
Safe Harbor Statement
Setup
Custom Transaction Record Type

I created a custom transaction type – NSI Journal Entry – to use for testing. I opted for a transaction as the common knowledge is that NetSuite transaction records are generally “heavier” than custom record types. A new transaction type allowed me to easily exclude the effects of existing customizations without impacting other users in the account. By this, I mean that whereas I could use say a Sales Order, I would then have to strip off any existing client scripts running on that record type which would in turn impact other users. With a new custom transaction type, I did not have to worry about any of that.
I kept the custom record simple, only exposing the minimum number of fields and sublists as we know that too many fields on a form can have a performance impact.
Client Script
Next, I created and deployed dummy client script(s) to the custom transaction type and performed a series of tests on a single record with and without the dispatcher pattern in place as described in Part 1.
With each test, I recorded the performance data using the Page Performance Details tool. I repeated each test 5 times and took an average.
Note that 5 is not a magic number; I could have done 10, 20, or more runs. However, based on NetSuite performance assessments I conducted in the past, I have observed that 5 tests are sufficient to give reasonably accurate results. In those cases, I did 5 tests and compared the average to corresponding metrics from APM over 30 days and the results were within the same order of magnitude.
Results
Baseline Performance
To establish baseline performance, I undeployed all client scripts on the NSI Journal Entry transaction type, loaded an entry in edit mode and noted the performance details after each load. Here are the results of 5 tests:

In case you are not familiar with these metrics:
- Server time is the total time spent on NetSuite’s server while servicing the request. In this case, retrieving the record from the database. If there are
beforeLoad()server-side (user event) scripts or workflows, they will contribute to this number. As the results above demonstrate, we had no server-side customizations. Thus, the server time is solely due to NetSuite’s internal logic. - Network time represents the time spent communicating with the server. Internet connection will contribute to this. Anecdotally, I once had a client who was experiencing significant performance issues. Using the page performance details tool, we noticed that the network component was unusually high. It turned out they had a poor internet connection at their office!
- Client time is the total time spent on rendering the page in the user’s browser plus any client-side scripts and workflow hooks. In our case, upon editing, the page, the
pageInit()event of any client scripts implementing that hook will be called and contribute to the client time. Thus, for our study, this is really the key metric. However, we will present results that show all components for consistency.
Key Observations
- The baseline performance (total) is about 3 seconds. This is consistent with observations in multiple NetSuite accounts. Out-of-the-box this is typical performance. If someone is promising you something else, be sure to verify.
- In this pristine state, 2.2 (72%) of the 3 seconds is spent on rending the page in the browser i.e. client-side. This is not because my browser is slow (I used Chrome by the way). Instead, the NetSuite user interface is simply slow. This explains why we can get much higher performance with custom user interfaces. Prolecto has showcased many such applications in recent blog articles. Note that, as customizations get added, the ratio of server vs. client-side time typically changes.
Performance with Client Scripts Deployed
In the next round of testing, I deployed 10 placeholder client scripts to the NSI Journal Entry transaction type. All each of these client scripts does is print a line to the console upon loading the record.
Here’s the implementation of one of them (the only difference between the scripts is the placeholder tag):
/**
 * @NApiVersion 2.1
 * @NScriptType ClientScript
 * @NModuleScope SameAccount
 */
define([],

function() {
    const TAG = 'PLACEHOLDER 1';
    /**
     * Function to be executed after page is initialized.
     *
     * @param {Object} scriptContext
     * @param {Record} scriptContext.currentRecord - Current form record
     * @param {string} scriptContext.mode - The mode in which the record is being accessed (create, copy, or edit)
     *
     * @since 2015.2
     */
    function pageInit(scriptContext) {
        console.log(`I am ${TAG}`);
    }

    return {
        pageInit
    };

});
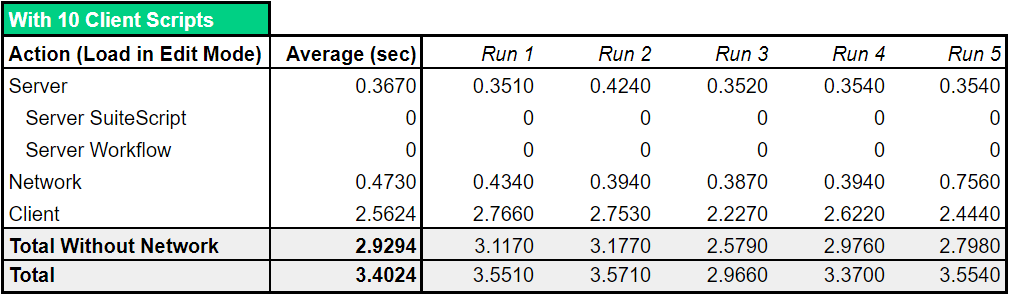
I loaded an NSI Journal Entry record in edit mode which triggered the client scripts and noted the performance details after each load. Here are the results of 5 tests:
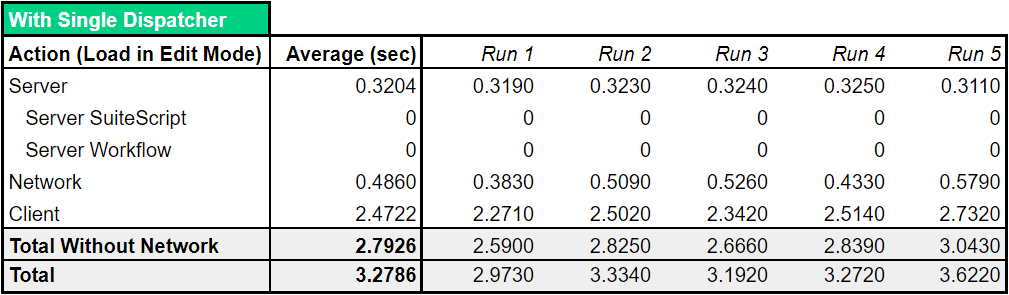
Performance with Dispatcher Script
In the final stage of testing, I replaced the 10 client scripts with the single dispatcher script. Additionally, I used to pattern to execute two extra client scripts i.e. 12 client scripts in total. Here are the results of 5 tests:
Findings
The following table summarizes the results:
| Action: Load in Edit Mode | Baseline (sec) | With 10 Client Scripts (sec) | With Single Dispatcher Script (sec) |
|---|---|---|---|
| Total | 3.0630 | 3.4024 | 3.2786 |
| % Performance Loss w.r.t. Baseline | -11% | -7% | |
| Total w/o Network | 2.5614 | 2.9294 | 2.7926 |
| % Performance Loss w.r.t. Baseline | -14% | -9% | |
| Client-Side Only | 2.2140 | 2.5624 | 2.4722 |
| -16% | -12% |
Since we are assessing client script performance, the client-side-only numbers should suffice. However, for the sake of completeness (and curiosity), we consider the other categories as well. The total without network effects is interesting as it excludes variability due to internet bandwidth, latency, caching, etc.
Key observations:
We can make several assessments of this data. Here are the ones that stand out to me:
- In all three categories (total, total w/o network, and client-only), the dispatcher script outperforms the setup with multiple client scripts directly deployed to the record by 4% to 5%. However, while this might appear exciting, we must consider these values in perspective. Will a user really notice the difference between 3.28 seconds and 3.40 seconds (total) when loading a page in edit mode?
- The number of deployed client scripts does not appear to significantly impact performance. The time difference (total) between a single dispatcher script and 10 separate client scripts is less than 150 milliseconds (3.4024 – 3.2786 seconds).
Simulating Real Work
The observations above (particularly #2) suggest that the *number* of client scripts deployed to a record, by itself, is not material to overall performance. What those scripts do obviously makes a huge difference. We have tested thus far with dummy scripts that do nothing. I was curious what would happen if our client script did “real” work. Would the relative performance change significantly? To simulate real work, I modified the client scripts to include a 1-second delay by calling out to a (free) delay service upon loading the page. Here’s the implementation (notice line #21).
/**
 * @NApiVersion 2.1
 * @NScriptType ClientScript
 * @NModuleScope SameAccount
 */
define(['N/https'],

function(https) {
    const TAG = 'PLACEHOLDER 1';
    /**
     * Function to be executed after page is initialized.
     *
     * @param {Object} scriptContext
     * @param {Record} scriptContext.currentRecord - Current form record
     * @param {string} scriptContext.mode - The mode in which the record is being accessed (create, copy, or edit)
     *
     * @since 2015.2
     */
    function pageInit(scriptContext) {
        console.log(`I am ${TAG}`);
        const response = https.get('https://hub.dummyapis.com/delay?seconds=1');
        console.log(`${TAG} - ${response?.body}`);
    }

    return {
        pageInit
    };

});
This successfully simulates real work as evidenced by the console logging. Note that we did not add delays to placeholder script libraries 11 and 12 as that would otherwise skew the numbers and make it hard to compare to the 10-client script alternative.

Findings
The following table summarizes the results (once again based on the average of 5 executions each):
| Action: Load in Edit Mode | Baseline (sec) – Unchanged | With 10 Client Scripts with Delays (sec) | With Single Dispatcher Script with Delays (sec) |
|---|---|---|---|
| Total | 3.0630 | 16.4408 | 16.1634 |
| % Performance Loss w.r.t. Baseline | -81.3% | -81.1% | |
| Total w/o Network | 2.5614 | 15.9090 | 15.7366 |
| % Performance Loss w.r.t. Baseline | -80.8% | -80.5% | |
| Client-Side Only | 2.2140 | 15.7066 | 15.5464 |
| -80.5% | -80.3% |
Key Observations
- Unsurprisingly, we observe an increase in 10+ seconds relative to the baseline due to the delay we introduced to simulate work.
- Interestingly though, the performance loss of the dispatcher script relative to the 10-script scenario is now almost the same. Thus, as we begin to do real work, the relative performance benefit of the dispatcher pattern diminishes. Again, in the big picture, no user will be able to distinguish 16.16 seconds from 16.44 seconds with the naked eye. Thus, from a user’s perspective, it will effectively be the same (and if these were real performance numbers, that 16 seconds would get your users rolling their eyes and complaining about how slow NetSuite is!).
Note that if our assessment was focused on background processing of multiple records, then these differences, though small in an absolute sense, could quickly add up! For example, a difference of 0.28 seconds per record would become 2800 seconds (> 45 minutes) when processing 10,000 records.
The Verdict
We’ve obtained and reviewed the numbers. But, the question remains: Is there something magical (or even logical) about the 10 client-script limitation? I strongly believe that there isn’t. The number of scripts deployed to a record does not directly translate to system load and thus performance. Nevertheless, it is generally true that the more scripts, the higher the likelihood of inefficiency and performance degradation. I suspect the 10 script limitation was an architectural decision based on considerations that NetSuite has not and likely will not make public. Perhaps, based on tests, they observed that around this number, pages started to freeze on average. However, again, it depends on what the scripts are doing. 20 “light” scripts may outperform one “heavy” script. Our results suggest that the overhead of loading multiple scripts is insignificant.
By my assessment, the 10 client script hard limit aims to get you thinking.
NetSuite’s customizability is a double-edged sword. It allows us to enhance the system and implement tailed business processes often producing amazing outcomes that would otherwise be impossible. On the other hand, this benefit often comes at a cost. Bloat, “technical debt”, and performance issues are recurring themes in the NetSuite ecosystem. Sometimes, it is hard to get senior leadership to take these matters seriously until we hit hard limits like this one. Once that happens, people start to pay attention and there is an opening for a conversation that, if done right, will lead to positive change. To me, that’s what really matters. Whether NetSuite sets the limit at 10 or 20 scripts is somewhat immaterial. What matters is that we pay attention to system health and take preventive or corrective action before our negligence begins to hurt the business.
While the dispatcher pattern is a quick fix to workaround the 10-script limitation, it is *not* a performance-tuning measure. Thus, if you find yourself implementing this pattern, be sure to follow it up with a proper performance assessment and real fixes.
Performance assessments can be tricky. I hope that this article has provided a framework for making these kinds of assessments in NetSuite. Is your organization facing NetSuite performance issues? Are you having difficulty uncovering the sources of the issue and/or convincing management to pay attention? Perhaps, it’s time for a conversation!
NetSuite Insights is proud to partner with Prolecto Resources Inc. – the unrivaled #1 NetSuite Systems Integrator and thought leader in the space! Learn more about how Prolecto can supercharge your NetSuite experience and deliver the best return on your NetSuite investment.
I would recommend to use the performance tool in chrome to measure the actual performance of the client script.
That’s a great idea for getting the breakdown of what happens on client-side. My guess is that most of it will be rendering…